





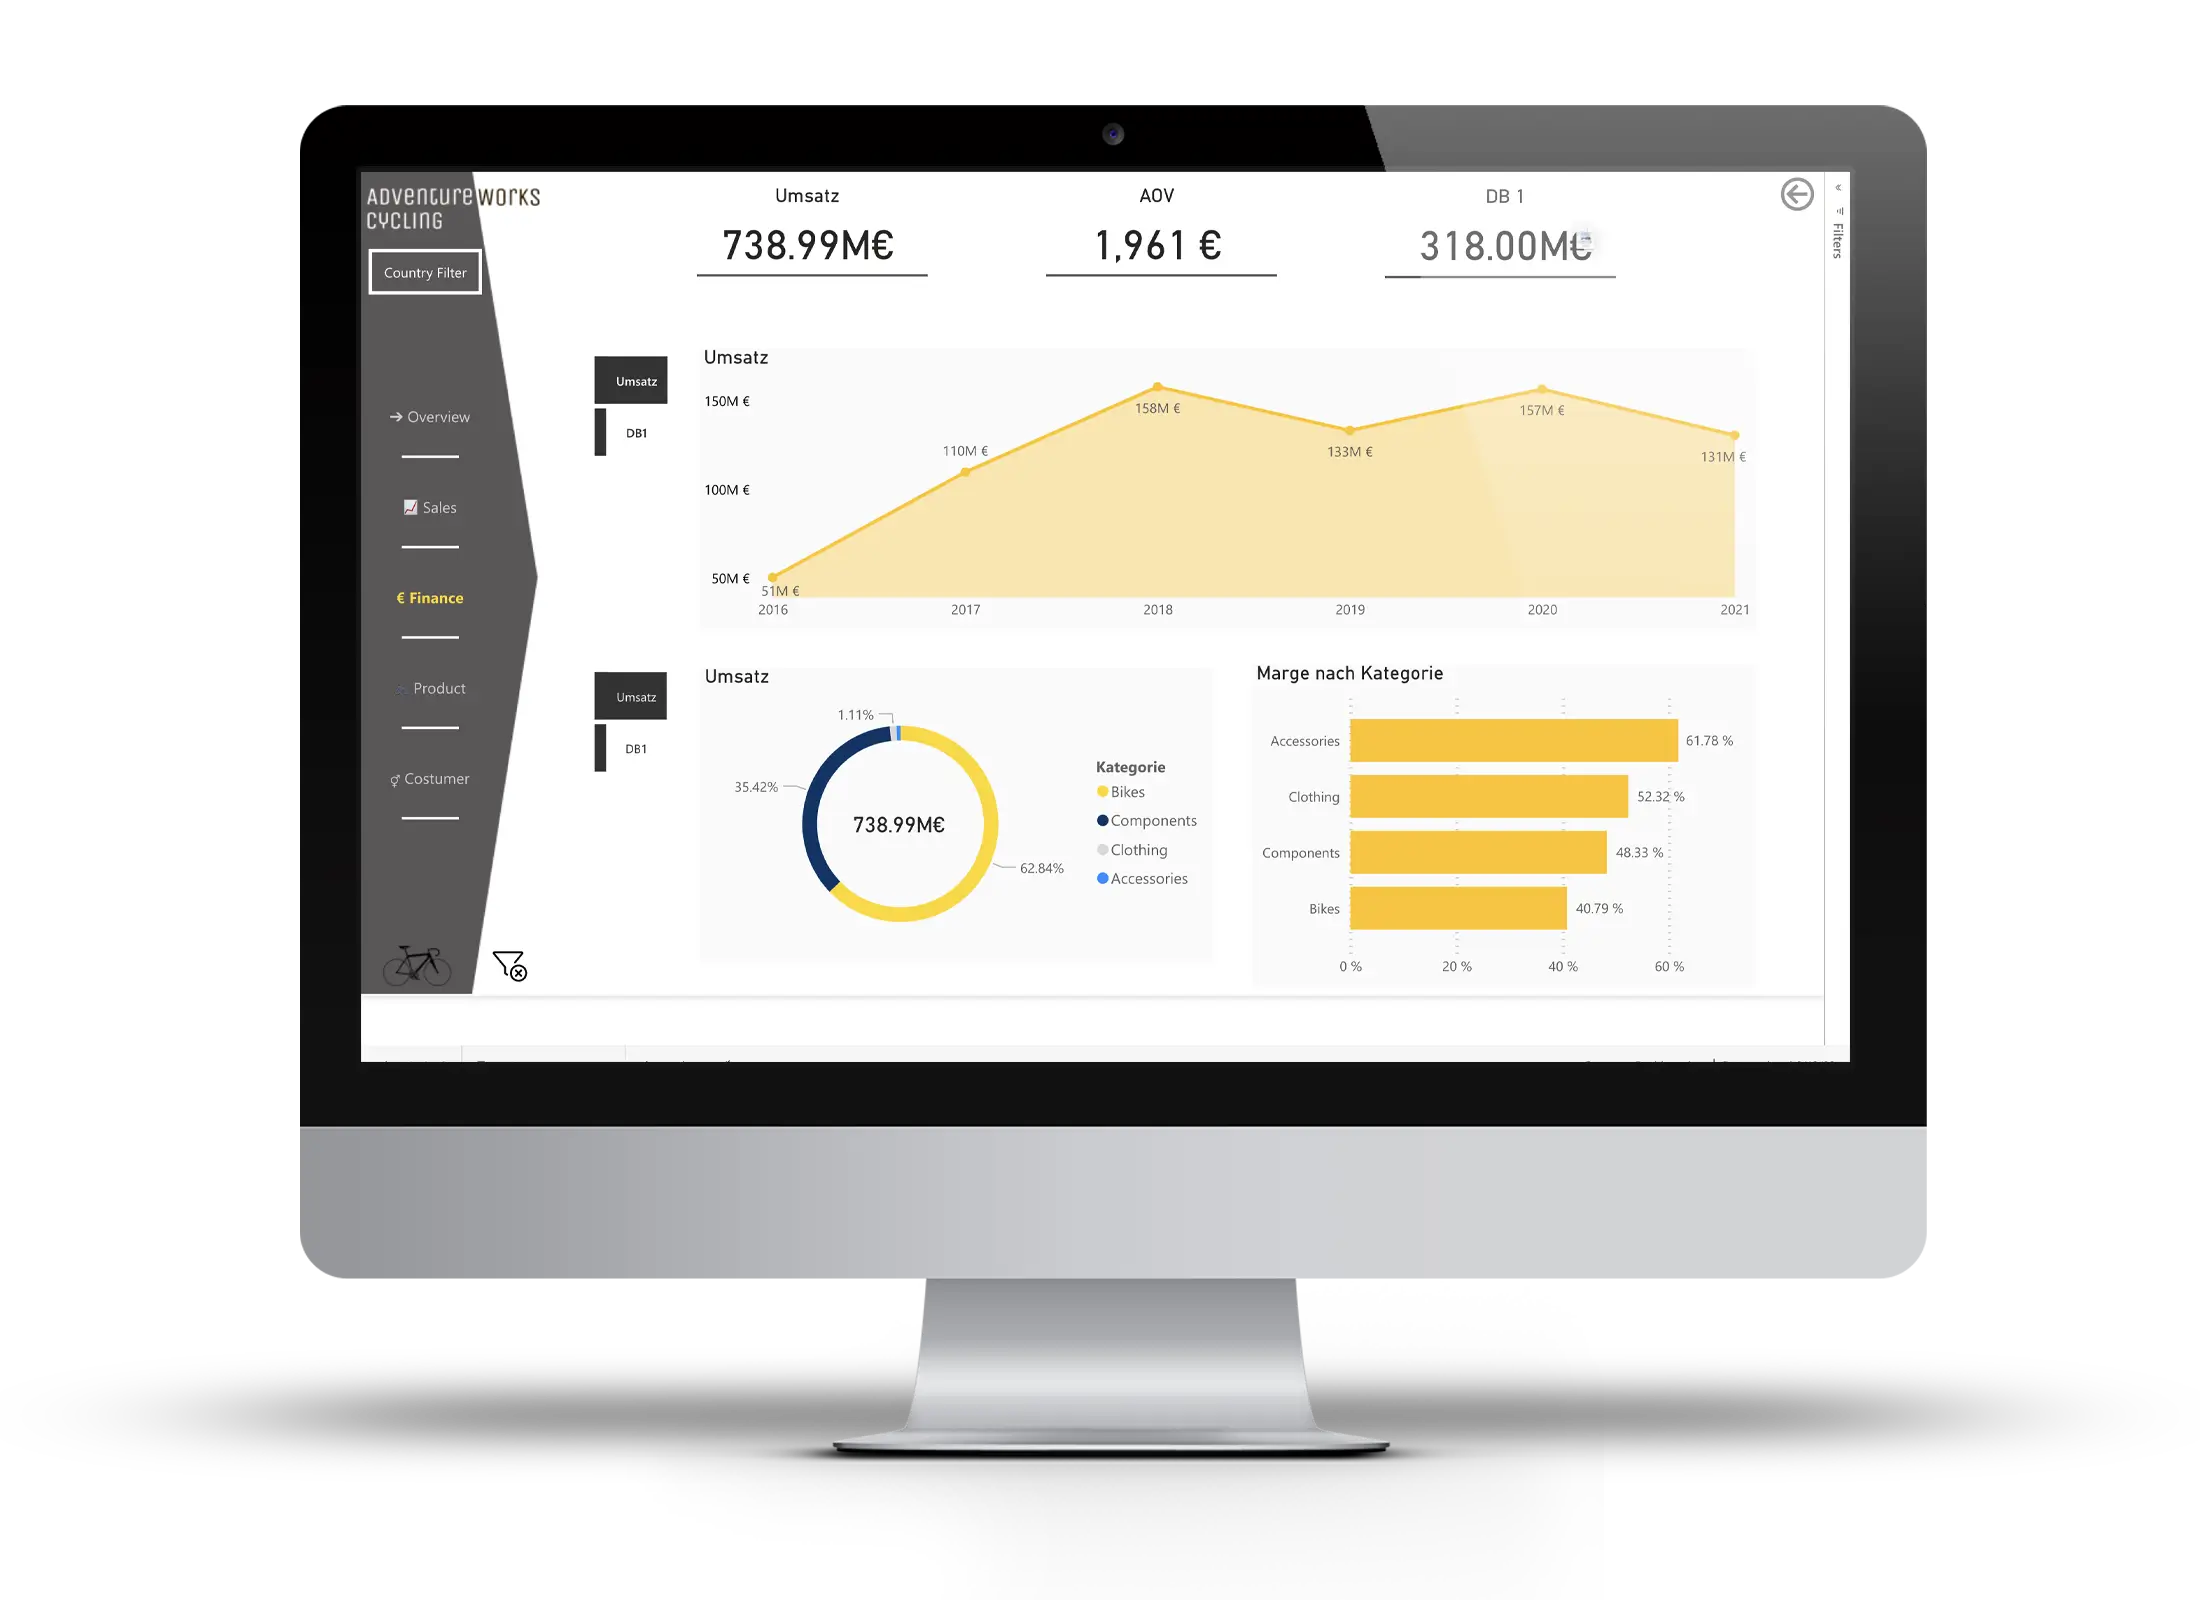
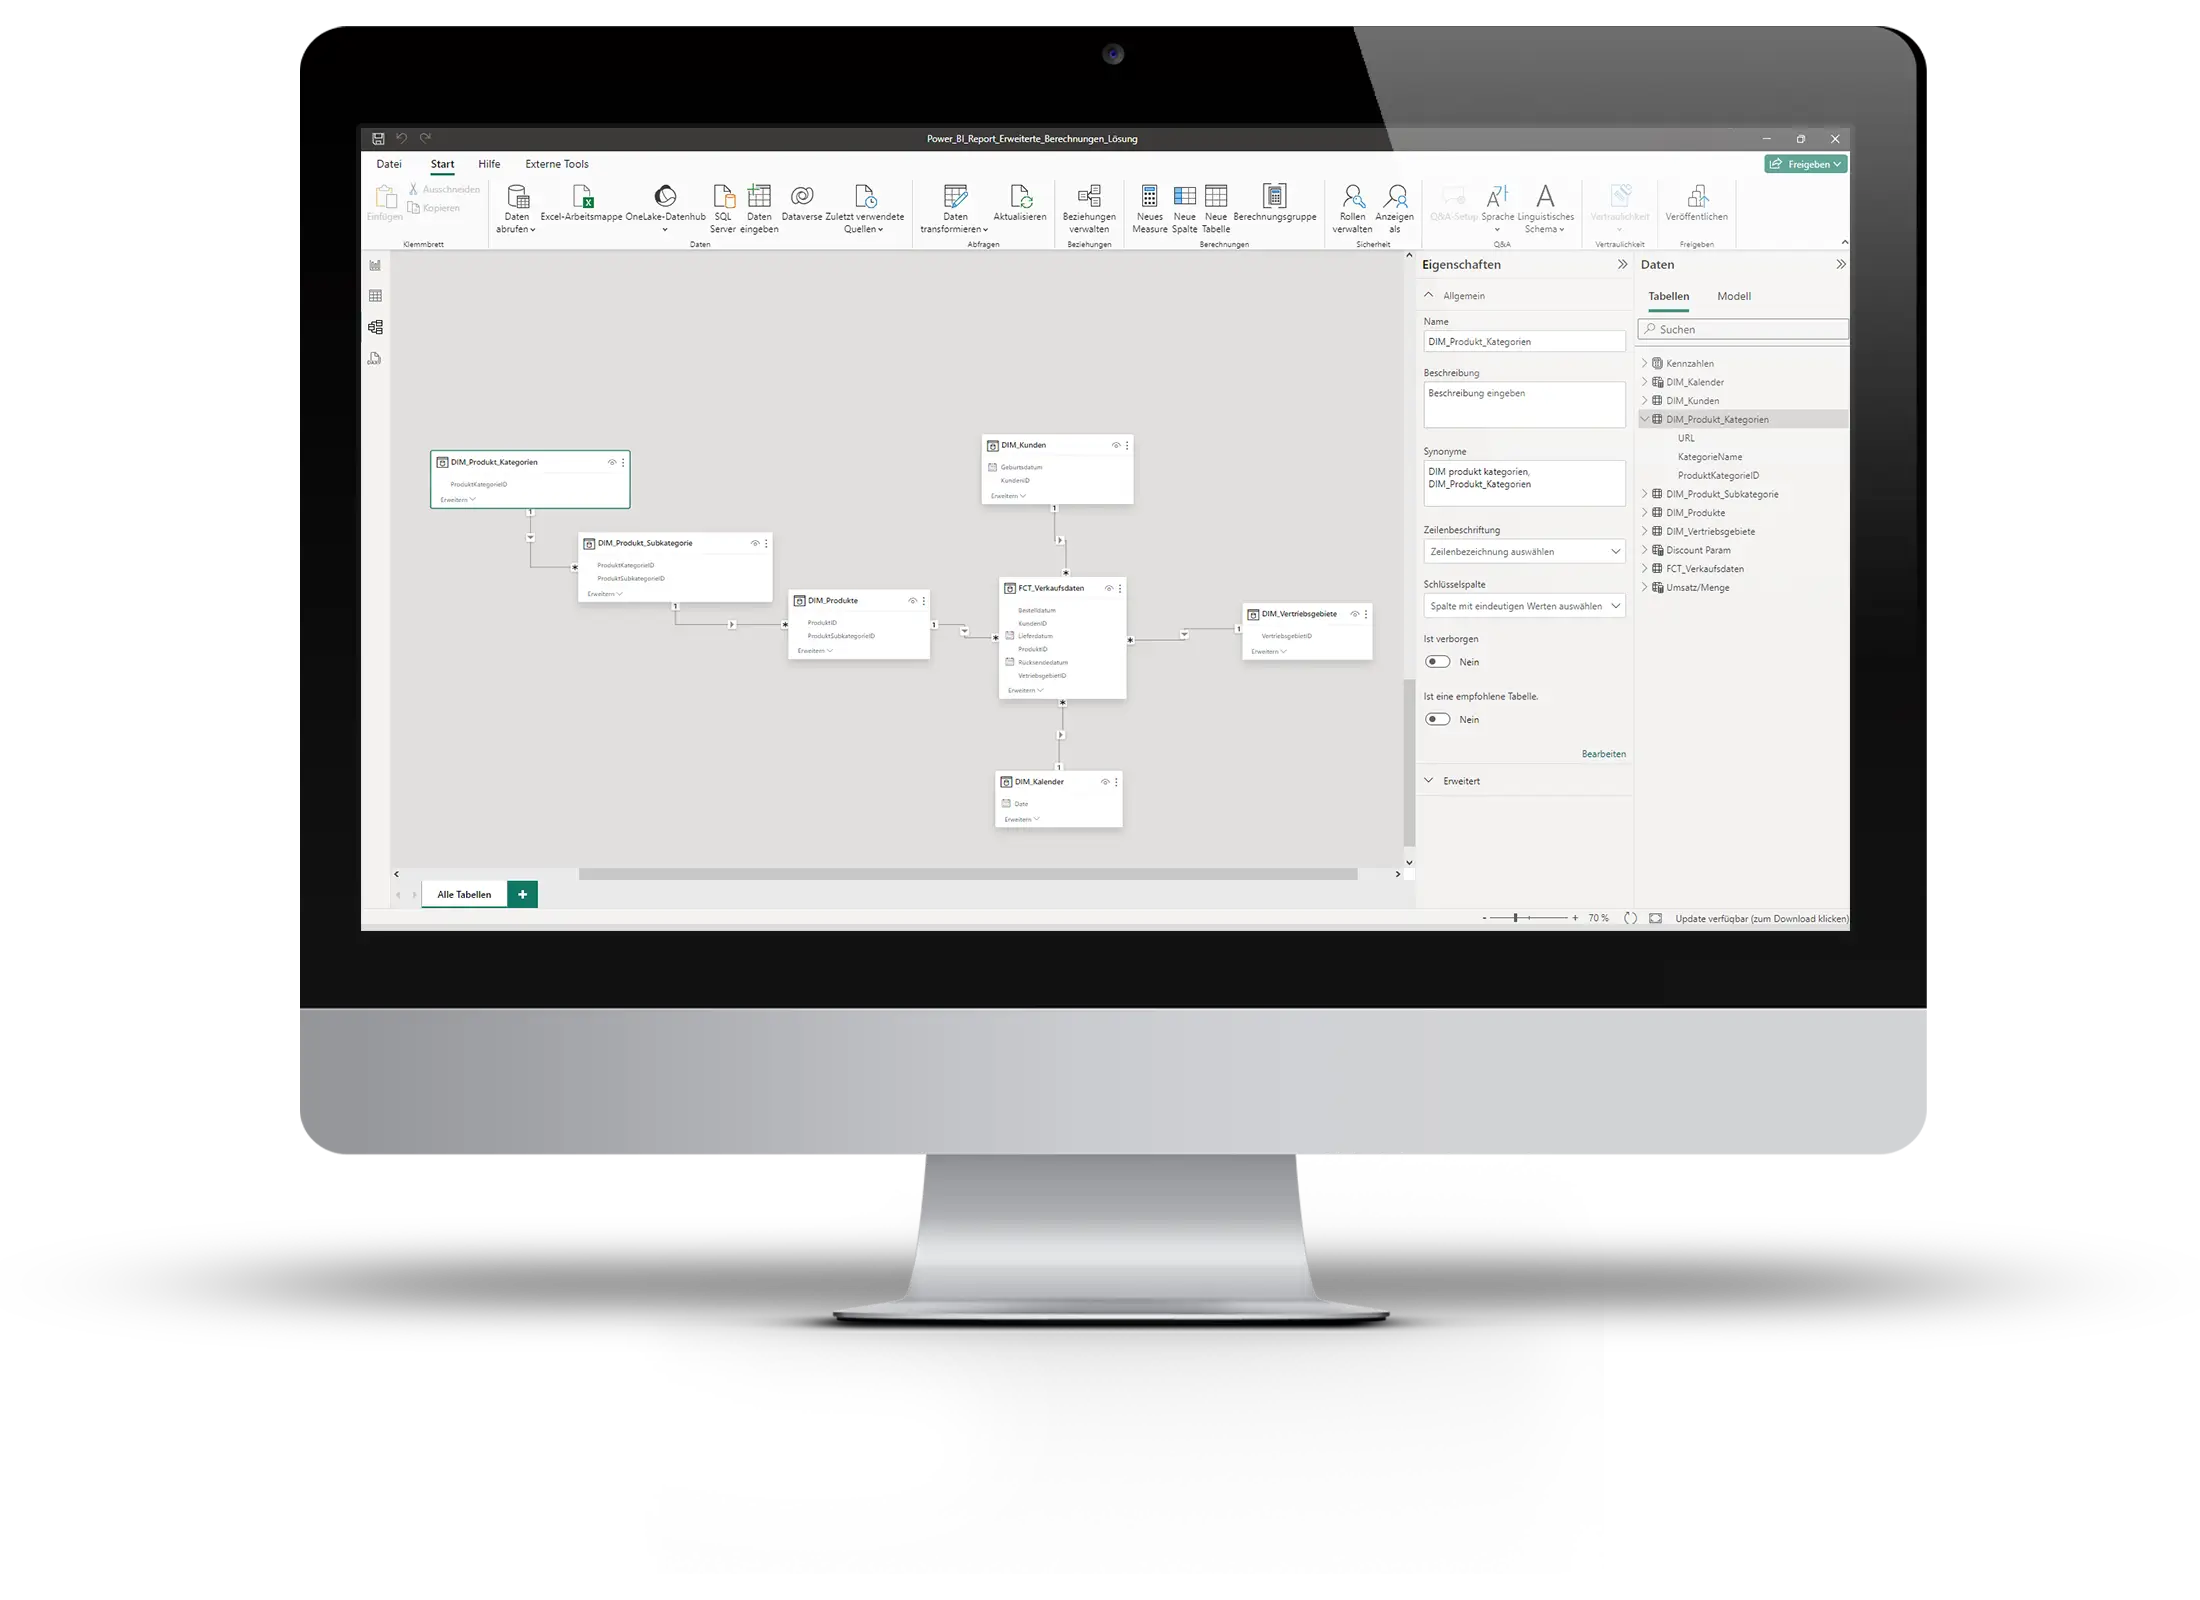

Many companies know that their data has enormous potential, but in everyday life, the picture is often different. Reports that confuse more than help Dashboards that load slowly or provide incorrect values. Data sources that don't come together cleanly. And decisions that are based less on facts than you would like.
Our Power BI consultants make your data usable, understandable and effective. We design dashboards, models, and governance to fit seamlessly into your organization. With a clear eye for structure, performance and user needs, we develop solutions that accelerate decisions and uncover the potential of your data step by step.

Together, we clarify which KPIs are relevant for decision-making, which data sources must be connected and what the technical infrastructure should look like.

We build high-performance, well-structured, CI-loyal reports with sophisticated UX design. Integrated into your Microsoft environment, extensible, versioned and documented.
Who can see what? We structure your Power BI environment with clean workspace concepts, row-level security and clear responsibilities.
We connect your source systems, model the data cleanly and store it in a data warehouse or lakehouse.
Power BI embedded directly into your apps. For broad target groups without each user needing their own license. We take care of the technical integration, from setting up Azure to embedding in your interface.
To guarantee self-service data analysis for employees, we carry out Power BI training & coachings through.

In 1–2 Tagen entsteht ein erster Report-Prototyp mit ausgewählten eigenen Daten, als Grundlage für die weitere Umsetzung.

Der Health Check zeigt, wo bestehende Power-BI-Lösungen technisch und organisatorisch verbessert werden können.
We are both implementers and consultants. We also cover all services along the data journey.
We have direct access to new features, close contact with Microsoft and certified expertise for Data & AI on Azure.
We start with an MVP dashboard. That way, you can see early on what's working and help you steer.
From the data strategy to the cloud platform to the finished dashboard, we cover the entire data journey.
We don't think in reports, but in terms of overall strategy. This means that we jointly question which measures have the greatest leverage.
To speed up our work and yours, we integrate AI features where they make sense.
%20(1).webp)
Modern BI as a driver of digitization at Raiffeisen Südtirol
.svg)



Individual Excel files, PowerPoint presentations, and more than ten heterogeneous data sources prevented a unified view of operational and personnel key performance indicators.
More than ten data sources are merged automatically. The cockpit provides transparency across four active rail networks and approximately 750 million train kilometers traveled annually in regional passenger transport.
Manual Excel reporting, disparate ERP systems, legacy data sets, and international growth made consistent reporting difficult.
A central data platform in Microsoft Fabric connects all relevant data sources. This serves as the foundation for Power BI reports for Finance, Sales, and project controlling, as well as self-service analytics for business departments.
Around 140 non-integrated data pipelines, data inconsistencies, reliance on Excel, and a lack of code versioning led to redundancy and high maintenance overhead.
A centralized Data Vault model standardizes the data structure. Automated dbt jobs handle transformations, while Power BI accesses the consolidated data foundation.
We clarify goals, scope and key stakeholders and define a pilot use case.
We connect initial source systems, build a clean data model and develop a first dashboard.
We expand reporting, conduct training, and establish governance rules so that departments can work securely with Power BI.Schulungen durch und etablieren Governance-Regeln, damit Fachbereiche sicher mit Power BI arbeiten können.
If you wish, we will support you on an ongoing basis. With new use cases, optimizations and advanced analytics.
Die Zusammenarbeit lohnt sich nicht erst bei großen, unternehmensweiten BI-Projekten. Auch ein kleiner, klar abgegrenzter Use Case kann ein sinnvoller Einstieg sein. Für einen Piloten können beispielsweise ein oder zwei Datenquellen angebunden und ausgewählte KPIs in einem ersten Dashboard visualisiert werden. So entsteht schnell ein sichtbares Ergebnis, ohne dass direkt eine umfassende BI-Landschaft aufgebaut werden muss.
Die Kosten hängen von der Größe und dem konkreten Umfang des Projekts ab. taod kalkuliert auf Basis eines vereinbarten Tagessatzes und des voraussichtlichen Aufwands. Der Projektumfang und die voraussichtlichen Kosten werden vor dem Start gemeinsam eingegrenzt und transparent abgestimmt.
Ja. taod kann bestehende Power BI-Umgebungen analysieren, weiterentwickeln und bei Bedarf strukturell optimieren. Dabei betrachten wir unter anderem vorhandene Berichte, Datenmodelle, Datenquellen, Berechtigungskonzepte und die bestehende Dokumentation. Auf dieser Grundlage klären wir, welche Komponenten weiterverwendet werden können und an welchen Stellen Anpassungen sinnvoll sind.
Performance is achieved through optimized data models, reduced data volumes, clean calculation logic and a suitable backend architecture. Technical quality has a direct impact on usage and trust.
Bei klaren Anforderungen und gut vorbereiteten Daten kann die reine Umsetzung eines einfachen Use Cases bereits innerhalb von ein bis zwei Personentagen erfolgen.
Die gesamte Projektdauer hängt jedoch auch von der Datenqualität, der Definition der KPIs, der Anzahl der anzubindenden Systeme und den benötigten Abstimmungen ab. Einen konkreten Zeitplan legt taod nach der ersten Analyse gemeinsam mit dem Kundenteam fest.
Beides ist möglich. taod unterstützt bei klar abgegrenzten Projekten ebenso wie bei der langfristigen Weiterentwicklung einer BI- und Analytics-Landschaft. Die Zusammenarbeit kann beispielsweise mit einem Pilotprojekt oder einem einzelnen Dashboard beginnen. Anschließend können weitere Datenquellen, Fachbereiche, Kennzahlen oder Anwendungsfälle schrittweise ergänzt werden.
Nach dem initialen Projekt sind auf Wunsch auch Support, Maintenance, Coaching und die kontinuierliche Weiterentwicklung der Lösung möglich. Für laufende Leistungen können individuelle Servicevereinbarungen und SLAs definiert werden.
Datenschutz und Datensicherheit werden bereits bei der Konzeption der Lösung berücksichtigt. taod arbeitet grundsätzlich mit den Datenzugängen und Systemen, die durch das Kundenteam freigegeben werden. Zugriffs- und Berechtigungskonzepte können so umgesetzt werden, dass Nutzer ausschließlich die für sie vorgesehenen Daten sehen.
Dadurch lässt sich beispielsweise dasselbe Dashboard für verschiedene Abteilungen, Standorte oder Kunden verwenden, während der sichtbare Datenumfang individuell eingeschränkt wird.
Welche konkreten Maßnahmen erforderlich sind, hängt von der bestehenden IT-Landschaft, den Datenarten, der gewählten Infrastruktur und den internen Sicherheitsvorgaben ab. Diese Anforderungen werden zu Projektbeginn gemeinsam mit den zuständigen technischen und fachlichen Ansprechpartnern abgestimmt.
Yes. taod helps companies both in selecting suitable Power BI license models and in providing and managing licenses.
Power BI is an analytics and visualization tool. Microsoft Fabric is an integrated data platform that bundles multiple analytics and data services. Power BI is often part of Fabric, but it can also be used independently.
Power BI is particularly suitable for companies with Microsoft-related infrastructure, a high need for integration into existing systems and standardized reporting. Tableau can have benefits in other scenarios, such as exploratory analysis. The choice depends on the use case, the organization and the existing data landscape.
With clear standards, governance and training, departments can use Power BI independently without jeopardizing quality or security. The goal is controlled self-service.

Enablement for Siemens, Vodafone & Coca-Cola

BI strategy, dashboards, or tool selection. We advise you and implement for you.

Make an easy decision for the most suitable tool with our guide